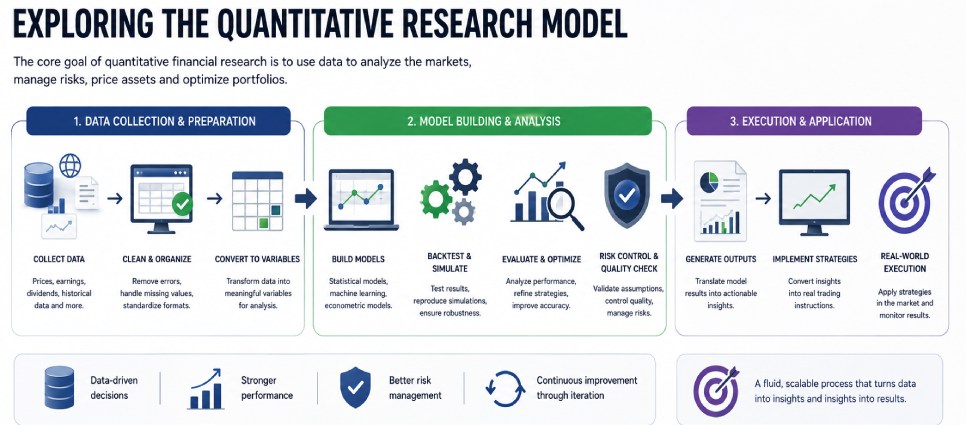
Model building can be as layered or multi-faceted as the research demands. This is where the analysts must shape their key goal from the quantitative research. Whether it is solely using machine learning models to identify patterns or inefficiencies, optimizing projections using historical datasets, or analyzing fluctuations in a market to find strong investment opportunities. Model building does not always go from A to B either, as the models need to be fluid and scalable enough to continuously backtest the results, reproduce simulations for assurance and controlling the quality, and test strategies to see how they may respond in real world scenarios.
Finally, the execution of the quantitative process is when the outputs from the models and analytical research are put into practise. The outcomes are translated to real life trading instructions, which can then be put into place and used in accordance with the findings and the key principles as determined by the model.
Significance of Data Compatibility
Given the huge diversity of applications where quantitative research can be used, this creates an even larger pool of measurable data that could be relevant for the research. The datasets can have lengthy historical inputs, tracing back years, with both information that is relevant and those that have since become obsolete. Other pools of information can have different formats, a simple example being binary variables compared to numerical values, or grouped data that defines a single range of numerical values.
Then, there are the sources to consider, which can also create inconsistencies between the data itself. Whether the data is coming from different sectors, such as healthcare, social sciences or machine learning research, or, in the scenario that the data comes from the same source, but over time the recording data protocols have changed. Thus the language or the input value of the data changes over time, creating inconsistency. These are all impacts that can directly impact the way data is logged and measured, which makes it all the more difficult to plug into the quantitative research. As they need to have a common language, or a formula that can accommodate all the inputs in their native format, while creating an output that is measurable and accurate.
Real World Data Importing Practicalities
In the world of practical quantitative research, importing data is far from a straightforward task. While there are methods where all that is required is opening a spreadsheet and running a model, this process is typically a lot more complex. It involves information coming from multiple platforms, recorded by different providers, and logged into storage systems, each of which has its own structures and formatting rules. Even datasets that appear similar on the surface can contain hidden inconsistencies that create serious problems later in the modeling process.
This is why the importing step of the process is one of the most crucial parts for the system to work. Analysts must ensure that the imported variables fit into the system, remain consistent, that they use the right formatting or rules, and that the software that is used can understand all of this. In the meantime, the models should be flexible enough to accommodate fresh inputs, and sustain continuous calculations, so that they can work in real-time and provide efficient outcomes. This must all be done without the information distorting or creating a numerical instability within the model.
Importing Data from Spreadsheets
Spreadsheets remain one of the most widely used formats in quantitative research because they are accessible and relatively simple to organize manually. Researchers frequently use spreadsheet software for collecting market prices, storing financial statements, organizing surveys, and tracking economic indicators over time. These are accessible for entry level users, and they can record detailed information with little to no calculating or working out involved. It is digital data stored in one of the rawest formats, but that also creates more responsibility for anyone using this format.
Because spreadsheets also create several compatibility risks. Different users may apply different date formats, decimal separators, currency notations or naming conventions. For every input that differs from the rest, this can cause inconsistencies or rifts within the system. The data, unhandled, would either delay the entire system or create errors that would require lots of backtesting to filter out.
In international research, even regional formatting differences can create major import issues. A European spreadsheet may interpret commas and decimal points differently from an American dataset, which can completely alter numerical values during imports.
Manual editing also creates inconsistencies over time. Variables may change names, formulas can accidentally be overwritten, and hidden formatting errors can distort statistical calculations. For large scale quantitative research, spreadsheets are often useful during the early collection phase, but less reliable for large automated workflows.
CSV Systems
CSV systems are often considered one of the most universally compatible data formats in quantitative research. Since CSV files store raw tabular information without proprietary formatting, they can usually be imported into almost every statistical platform, programming language or database system.
This flexibility makes CSV files particularly useful when researchers need to transfer datasets between different environments. The lines in the file are plain text, so they are readable, virtually universally compatible, and easy to edit. A researcher could export financial data from one system, clean it in another software package, and then run econometric models in entirely another software, as is needed for the research.
Despite their simplicity, CSV systems must still be handled with care. Even differences in the encoding, slight delimiter mismatches, or simply data that is missing in areas can all create issues around the importing. Since CSV files also lack embedded metadata, researchers need separate documentation to explain variable definitions, units and missing value conventions.
For this reason, CSV files are highly compatible, but still require strong organizational standards to ensure accurate interpretation. These protocols must be ironed out and made clear first, to reduce the efforts to clean or convert the data into proper inputs, and also make the entire procedure more efficient.
Statistical Data Softwares
Many quantitative researchers rely on dedicated statistical software platforms that are specifically designed to process large datasets and perform advanced econometric modelling. The platforms can be tweaked to the needs of the users. That means, they can use the language protocols, intricate workflow procedures, and organizing data as is required. It all leads to providing greater analytic depth, in a more accessible and practical format. So that the results can be deciphered and applied. It also greatly enhances efficiency, specifically for large scale research models.
However, as useful as this is in-house for the internal workflow processing, it can cause importing inconsistencies when collaborating with external providers and structures. Below are two of the most widely used statistical software, dedicated to processing typically large datasets for analytic research.
SAS
SAS is widely used in institutional finance, healthcare analytics, insurance modelling and government research, among many other sectors. It is regarded as one of the most versatile and thorough software because of its ability to process extremely large datasets efficiently. The platform is particularly valued for its strong data management capabilities and its reliability in highly regulated environments.
In quantitative finance, SAS may be used for:
- Risk modeling
- Credit scoring
- Portfolio analysis
- Fraud detection
- Large scale forecasting
The scope of data that can be logged, managed and processed in SAS lends way for researchers or analysts in many sectors to conduct efficient projections. One of the major strengths of SAS is its ability to manage complex structured datasets with extensive metadata. However, compatibility challenges can arise when exporting SAS files into other research environments. Variable labels, formatting structures and proprietary dataset features do not always transfer perfectly into open source platforms. Researchers therefore often convert SAS datasets into more universal formats before sharing them externally. This process requires formating conditions, language protocols and collaboration on how data should be managed.
Stata
Stata is particularly popular in economics. Though it is also used in academic research functions, and among social science research, due to its balance between statistical capability and ease of use.
Many econometric studies involving panel data, regression analysis and policy modelling are conducted using Stata. It works well with longitudinal data and assessing complex survey information, which just adds to the usability and function of Stata.
The software includes strong tools for:
- Regression modeling
- Time series analysis
- Panel data analysis
- Hypothesis testing
- Survey data research
Stata datasets are generally easier to transfer across platforms than some proprietary systems, although compatibility issues can still emerge with variable labels, categorical encodings and version differences.
In collaborative research environments, it is common for analysts to export Stata datasets into CSV or other standardized formats before sharing them with external researchers using Python, R, or SQL systems.
Statistical Databases
Large statistical databases have become central to modern quantitative research. Instead of relying solely on static files, many analysts now connect directly to structured databases that continuously update in real time.
Examples of statistical databases include:
- Financial market databases
- Economic indicator repositories
- Government census systems
- Institutional banking databases
- Corporate earnings archives
These systems allow researchers to access vast quantities of historical and live data simultaneously. However, database compatibility becomes increasingly important when researchers merge information from multiple sources.
Different databases may:
- Use different variable naming systems
- Record timestamps differently
- Store currencies in different units
- Apply unique categorization methods
- Handle missing values differently
Without standardization, combining these datasets can introduce major analytical errors that compromise the validity of the research model.
Large Research Datasets
Quantitative research increasingly depends on massive datasets that extend far beyond what traditional spreadsheets can comfortably handle. Machine learning research, high-frequency trading systems and institutional financial modelling may involve millions or even billions of data points.
These large datasets often include:
- Tick by tick market movements
- Consumer transaction histories
- Macroeconomic indicators
- Historical derivatives pricing
- Alternative data sources
- Behavioral analytics
Handling datasets at this scale requires highly compatible systems that can process information efficiently without corrupting variables or slowing analytical workflows.
Researchers typically will move these datasets between systems like:
- Cloud storage systems
- SQL databases
- Python environments
- Statistical software packages
- Machine learning frameworks
The ability to seamlessly transfer information between these systems becomes essential for maintaining speed, scalability and research accuracy. It is critical to a quantitative research model that is designed for continuous use, does not have any inconsistencies, and can be maintained should a need to expand the system ever arises.
The Need for Standardized Formats
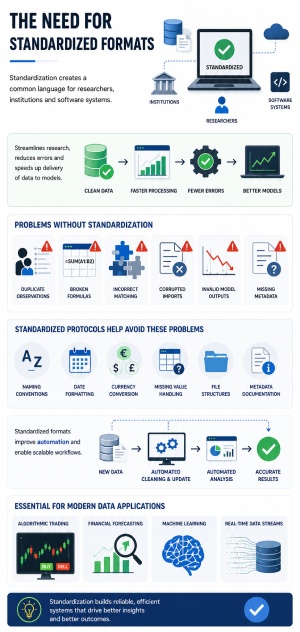
As quantitative research becomes more data intensive, standardized formatting becomes increasingly important. Standardization creates a common language that allows researchers, institutions and software systems to communicate consistently.
This streamlines the entire process for quantitative research as it limits the margin of error, data conversion procedures, and makes it a lot quicker for fresh or raw variables to be sent into the models.
It is perhaps easier to talk about the need for standardization by pointing out the various unwanted side effects of not having a protocol. Without standardization, analysts face issues such as:
- Duplicate observations
- Broken formulas
- Incorrect variable matching
- Corrupted imports
- Invalid model outputs
- Missing metadata
To avoid these problems, researchers typically establish standardized protocols for:
- Variable naming conventions
- Date formatting
- Currency conversion
- Missing value handling
- File structures
- Metadata documentation
Standardized formats also improve automation. Once variables follow consistent structures, researchers can build scalable workflows that automatically clean, update and analyze new data without requiring manual intervention every time new information is added.
This becomes especially important in algorithmic trading, financial forecasting and machine learning systems, where models may continuously process incoming data streams in real time.
Reproducibility in Quantitative Research
Reproducibility has become one of the defining principles of modern quantitative research. A study is considered reproducible when another researcher can access the same data, follow the same methodology, and generate the same statistical outputs.
This is required to ensure that the method is free of any errors, is stable, and can repeatedly generate the same outcome from the same data inputs. Reproducibility lends to reliability, as these are not one off results or the outcome of a biased test. The preproducibility is quickly becoming the benchmark for fair and trustworthy testing.
Poor compatibility directly undermines reproducibility because researchers may interpret the same dataset differently depending on the software environment being used.
How Reproducibility Works in Practical Terms
For example, one statistical platform may classify missing values differently from another. A categorical variable may also import incorrectly if encoding standards are inconsistent. Even minor formatting differences can completely alter econometric results.
These are all results of an inconsistent system, one that cannot be reproduced and therefore the results are dubious or not reliable.
This is why many institutions now require researchers to publish:
- Raw datasets
- Data dictionaries
- Import instructions
- Code scripts
- Preprocessing methodologies
Reproducible workflows improve transparency, strengthen confidence in research findings, and allow independent analysts to validate conclusions.
As quantitative finance and econometric modelling continue evolving, compatibility and reproducibility are becoming just as important as the models themselves. Without reliable data structures and standardized importing systems, even the most sophisticated quantitative research can produce unreliable conclusions.