For then, variables such as inflationary data, the asset price fluctuations and behavior, macroeconomic conditions, and other financial impacts can intervene, effectively rendering that linear regression model ineffective. It simply is not capable to factor all of these contrasting and unpredictable elements. That is where computational software comes into the picture. Because for deeper analytic research, with far larger datasets and complex variable integration, there is a need for layered mathematical equations, strict data compatibility requirements, and continuous simulations to monitor the real world conditions.
How the Econometrics Software Works
The goal of the software is to analyze the financial data, generating presentable outcomes that can be used to identify patterns, test theories, measure relationships, or generate different types of probability assessments. From the start, this requires a system that can handle a vast quantity of data and highly complex statistical calculations.
These cannot realistically be done manually, or where they can, it would take a high level workforce and time to process the data. Time and labor that can be used elsewhere, especially when there is software specially dedicated to handling these workloads.
The software is designed to handle all of these processes internally, creating a workflow to which academics and analysts can base evidence backed findings. These systems must be planned in advance as well. There are conditions for their operation, from what type of data inputs, and how these are formatted for the system, all the way to the computational methods the software uses to process the data and turn it into valuable outputs.
Design and Mechanisms of Computational Software
Onto the software itself, it is designed to automate calculations, aiding researchers who can then run regressions, simulations, probability matrices, and generate forecasting systems efficiently. These workflows are not just cheaper and less time consuming, but they also reduce the margin of human error drastically. Furthermore, through reproducibility, clear and automated processes, and structured workflows, it allows the users to maintain and even adapt the infrastructure to their needs.
This can be highly effective when datasets change, the volumes increase, or new inputs are put into the system, requiring a restructuring of the old working regime. It is key for econometrics modeling, macroeconomic forecasting, and machine learning research, which would be otherwise too expensive and time consuming to reproduce without dedicated econometric computing software.
History of Econometric Computing
The history of econometric thought and practise has humble beginnings, yet evolved into some of the most layered and complicated mathematical and economic functions. It has redefined the way financial research is conducted, and not just from an academic viewpoint.
For that was the purpose originally, before theory and mathematical expression became the driving force for financial decisions, pricing analysis, inflationary data interpretation, and many other disciplines. From small businesses to financial research databases at national or international scales, the need for econometric computing spreads to virtually all sectors. Where crossovers between different sectors occur, unpredictable variables occur, and the data inputs are incompatible in standard regression models, econometric computing can provide a solution that is accurate, reproducible, and unbiased.
Early Quantitative Analysis
The first examples of quantitative analysis and econometric work predate the modern computers, many consider the first empirical function to economic data being the First Quantitative Analysis published in 1696. It was made to assess corn price fluctuations in response to shortages. Econometric work was limited to manually calculated regressions, meaning statistical tables were limited and they could not factor in too many variables. The estimations were mostly done in comparison charts, or in relation to economic variables.
Without powerful computational software, the economists would have to filter data that could be utilized for the purpose of the mathematical expressions. Or, round data, and use other bias techniques to make these fit. They lacked the flexibility to accommodate more layered and complex analysis, and often the scales would also be limited, especially where dynamic financial systems were concerned.
Academic Roots
The academic developments in econometrics in the 20th century created a need for more complicated analysis. The foundations needed to be able to accommodate more structured formula and data input requirements, with repeatable statistical methods to give further proof and back evidence based findings. In universities, regression analysis, hypothetic testing, and probability theory became more widespread and integrated into economic research.
Theoretical mathematical models could find real world, and practical utility, though these were still all manually conducted and could not accommodate more layered solutions. It would not be long before early computers would completely transform this manual discipline, and gradually take on more of the computing tasks.
Computer Software Implementation
When mainframe computer systems became widespread, it allowed researchers to expand datasets monumentally. Calculations that would be handled manually could now be automated in iterative solutions, speeding up processes and allowing for more layered constructs. These systems allowed economists to write structured code, handling regression analysis but also implementing matrix operations and even statistical simulations. Already, they could perform functions and create outputs that were beyond what was manually possible.
But the technology was still highly specialized and not common knowledge. Also, these early systems had hardware limitations that constrained the depth to which the quantitative analysis could be examined. While systems were scalable, the tweaking or expansion was labor intensive and required a high level of expertise to manage, making it difficult to operate these efficiently.
Big Datasets and Modern Platforms
As the technology became more widespread, data availability expanded, and econometric software evolved, these hindrances were quickly addressed. In place of the older, hardware restricted and more manually operated computers, dedicated software was created to automate procedures, enhance processing speed and refine the modeling complexity. Through modern platforms and software such as Stata, SAS, and various data statistical modeling software, econometrics became more accessible and scalable.
Interfaces designed for user friendliness, with prebuilt statistical functions and automated tools became the norm, facilitating a lower entry level for analysts and more features through which the specialists could optimize and interpret the results. This also brought about the rise of cloud computing and distribution systems, allowed more processing capacity and for real time data variables to be integrated into the systems for more relevant results.
Command-Driven Analysis Systems
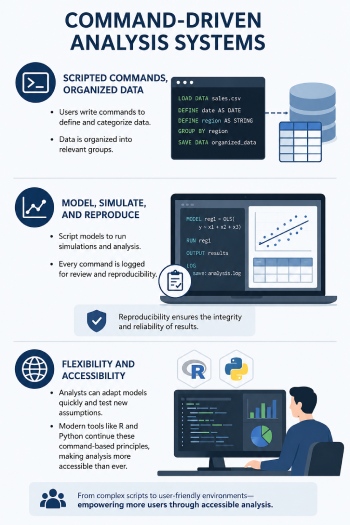
Command driven systems revolve around creating scripted instructions to execute specific procedures. This is one of the most important stages of the evolution in software development, as it reshaped the way computational software could understand and apply data inputs. In command driven analysis, the users write commands to determine what kind of datasets are being handled. This gives the software a reference or a contextual basis so it can define the data input. This is categorized, and can then be organized or neatly saved into a relevant group or subgroup.
Then, a model type must be scripted for the software to use those data points and create simulations or generate statistical procedures. As every command is scripted, logged for review, and even editable, it creates a workflow that is both easily scalable and simple to reproduce. For reproducibility is one of the most important aspects of statistical computing software. Results are only as valuable as the integrity of the procedure itself, and if it cannot be reproduced with the exact same output, this indicates a flaw in the syntax or the command scripting.
Expanding Accessibility and Technical Requirements
These systems also gave analysts far greater control over how econometric models were structured and executed. Instead of relying on rigid interfaces, researchers could modify variables, rerun procedures, and test alternative assumptions through simple code adjustments. This flexibility became especially important in financial research, where models often need to adapt quickly to changing market conditions or new data inputs. Over time, command driven systems became the foundation for many modern econometric platforms, influencing how statistical scripting and automated workflows are still designed today.
Even modern programming environments such as R and Python still follow many of the same command based principles introduced during this stage of development. Though there is a trend towards focusing on user friendly interfaces and plain language syntax to lower the entry level for users. As the systems become more advanced and sophisticated, they also become more widely accessible, so they can be edited and understood by workers or students with less technical background in mathematics, quantitative theory and econometrics.
Early Academic Statistical Software
Precursors to the modern, expansive datasets were often used in academic circles. Tools were created to assist analysts in processes such as linear regression, testing hypotheticals, and creating basic time series analysis.
Systems like early SAS and SPSS implementations became standard in universities and research institutions. These platforms reduced the need for manual calculation and introduced standardized statistical procedures that could be reused across studies.
Over time, these tools expanded their capabilities to include more advanced econometric techniques. From linear regression functions with simplified datasets, they went to more practical and applicable concepts such as panel data models, logistic regression, and variance analysis. This marked a shift from simple statistical computation to full econometric modeling environments.
Changes in Academic Approach
Academic software also played an important role in standardizing econometric education across universities and research institutions. Students and researchers could now learn statistical modeling using the same tools that were being applied in practical financial and economic analysis. This helped bridge the gap between theoretical economics and real world application, creating a more technically skilled generation of economists and analysts.
Many of these early systems also introduced reusable libraries and built in functions, which reduced the need to manually code every calculation from the ground up. This modularization effectively cuts the time and resources needed to rebuild or recreate certain systems or definitions of functions, helping to enhance the overall efficiency and scalability of the systems.
As these platforms matured, they became essential not only for academic purposes, but also for government research departments, banks, and financial institutions.
Shift Towards Moden Data-Processing
Modern econometric software has shifted from isolated statistical tools to integrated data processing ecosystems. Today’s systems are designed not only to estimate models but also to manage data pipelines, automate cleaning processes, and support real-time analytics.
This shift has been driven by three major forces: the growth of big data, the rise of machine learning, and the increasing demand for predictive analytics in finance and economics. As a result, econometric software now often overlaps with data science platforms, combining statistical rigor with computational scalability.
In practice, this means analysts can move from raw data ingestion to model deployment within a single environment. Whether forecasting macroeconomic indicators, evaluating financial risk, or testing policy outcomes, modern econometric systems provide a unified framework for end to end analysis.
Real Time Functionality
Another major change is the speed at which these systems can now process and react to incoming data. Older econometric workflows often relied on static datasets collected over long periods, whereas modern systems can continuously update models using live market or economic information. This is especially important in sectors such as algorithmic trading, banking risk analysis, and macroeconomic forecasting, where even small delays in processing can impact decision making.
Integration with cloud computing infrastructure has also made these systems far more scalable, allowing organizations to distribute workloads across multiple servers simultaneously. Combined with artificial intelligence and machine learning integration, modern econometric software is gradually moving beyond pure statistical analysis and towards predictive automation systems capable of adapting independently to changing economic conditions.
From Theory to Scalable Intelligence
Econometric software has evolved from manual calculation methods and mainframe computing into highly scalable, automated analytical systems. What was once a discipline constrained by time and computational limits has become a data driven ecosystem capable of processing vast and complex economic environments.
This evolution reflects a broader shift in economics itself. From static theoretical modeling to dynamic, continuously updated systems that respond to real world data in real time. As computational power continues to grow, econometric software will likely become even more integrated with machine learning and artificial intelligence, further narrowing the gap between prediction and reality.
The modern financial environment depends heavily on this computational infrastructure. Banks, hedge funds, governments, insurance providers, and research institutions all rely on econometric systems to evaluate uncertainty, monitor risk exposure, and forecast economic behavior. Without advanced software capable of handling layered datasets and continuous simulations, many of these processes would be too slow or expensive to operate effectively.
At the same time, the increasing availability of real time data means econometric models are no longer limited to retrospective analysis alone. Instead, they can now adapt dynamically as new information enters the system, allowing for faster and more responsive decision making. This transition from theoretical mathematics into scalable intelligence systems represents one of the most significant technological transformations in modern economic research.