So, how can we bridge the very obvious gap that exists between economic theories and the data from the real world? Econometric modeling software! This software allows people to separate correlation from causation, thus enabling them to predict what will happen in the real world should a given variable change. Given its ability to do so while isolating external variables, it has become an asset in various sectors, ranging from government agencies to academic institutions. Let us break down the gaps that this software fills in these industries and the types of tools you are likely to encounter in each of these cases.
Where and Why We Use Econometric Modeling Software
Econometric Modeling software has become so common that people even use it to make their own individual choices. For instance, many investors have been known to use time-series models to analyze stocks so as to figure out the options with the highest rates of return. And it is not only they who are using these models. Many women and men have turned to forecasting tools to determine how changes in inflation will affect their purchasing power, as this allows them to make informed long-term decisions. That is because this software is flexible for various uses and needs.
But away from these individual applications, econometric modeling software is more commonly seen in the following sectors:
Economic Forecasting
Various organizations rely heavily on economic forecasting, with the key players being government agencies, central banks, financial firms, and research institutions. As you would imagine, the reasons behind forecasting vary per organization. For example, central banks rely on these forecasts to determine whether they should raise interest rates to address rising rates of inflation or whether they should lower them to incentivize economic growth. But if you were to look at why financial firms were doing these forecasts, it would likely be a way for them to balance their asset portfolios and move assets around based on expected periods of downturns or growth.
Regardless of the reason behind economic forecasting, the goal is always to predict the future values of macroeconomic and microeconomic variables, such as inflation rates, unemployment, GDP growth, and consumer demand. To do this, organizations rely on historical patterns as these can inform the future. However, the main challenge that arises from this reliance is that economic data is very dynamic as it comprises cycles, trends, and seasonal shifts, all of which can steer the future one way or the other.
Since organizations have no way of knowing that these changes will follow historical patterns to the letter, they use econometric modeling software to break down historical data, as this allows them to assess each component on its own. Usually, they do this with tools such as R, SAS, and EViews, though there are many other software available in the market that serve a similar purpose.
Example
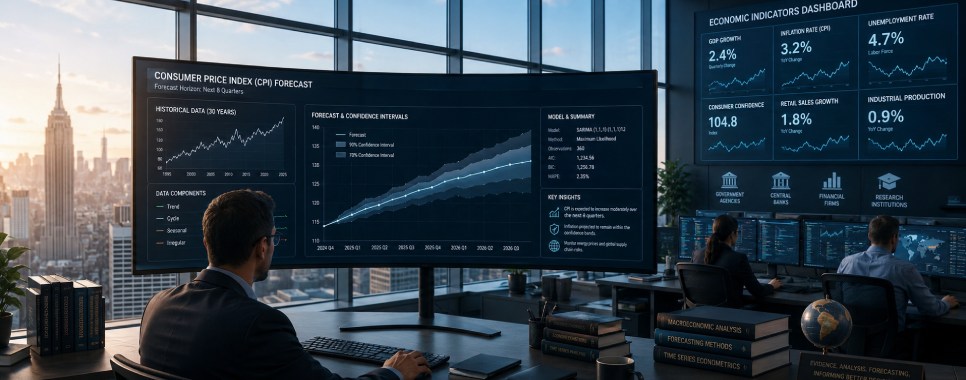
Let us assume that the central bank of country A wants to forecast the consumer price index for the next 8 quarters so as to determine whether it will adjust the current interest rates. Here, an economist can input 30 years’ worth of data on monthly consumer price indices into a tool like EViews, which would not only find historical trends but also stabilize the data before providing a chart that would map out the likely inflation rates alongside the confidence levels. This information would be much more reliable than using a simple economic model to predict the future.
Statistical Estimation
In an ideal world, we would study entire populations as this would allow us to understand them much better. But while this is possible in cases with small populations, that is not so when it comes to large populations. In fact, in the latter case, such studies are not only time-consuming but also very costly. And more often than not, they are physically impossible to undertake.
That is why we have come to rely on statistical estimation as it summarizes data from large datasets, quantifies uncertainty from these datasets, and helps organizations make decisions based on verifiable data. What’s more, statistical estimates become more precise over time as more data becomes available.
Thanks to this comprehensive approach, organizations are able to find the parameters that play a role in economic relationships that would otherwise not be observable. For instance, a government may want to determine how increased spending in the education sector affects future wages, which is not something that would be easily observed were it not for the existing datasets that allow the government to establish this relationship. But governments are not the only organizations using these estimates. They are also commonly used in financial firms, tech companies, and research institutes for various reasons. Researchers, for example, may use raw data to evaluate macro and microeconomic factors that could inform further research in economics and beyond.
Stata, R, and Python are the most widely used software in this regard because they are able to account for imperfections in the real world, such as omitted variables, endogeneity, and cases where the variance of errors is not constant.
Example
Let us go back to our example where the government wants to understand how investing in education impacts wages in the future. Here, they would face the challenge of measuring the variable ‘ability,’ which refers to a person’s natural drive or intelligence that would affect their education level and their earnings. After all, if the government just compared years of education to earnings, they could credit the wages that people earned to just education instead of ability. But even with this challenge, they would still be able to establish a relationship by loading raw data into a tool like Stata. They would need to address the bias by running a two-stage least squares, which would allow them to predict education while ignoring other factors such as ability, and then running wage data against these predicted education numbers, which would further isolate the impact of ability. This way, they would get an unbiased result, unlike if they tried to integrate ability into their model. And they would be in a position to determine whether investing in the education sector would have a positive impact on people’s wages in the future.
Financial Modeling
Anyone who works in a financial firm will tell you that every day revolves around making decisions that have long-term consequences. These range from where to allocate capital to how to estimate the worth of companies and how to determine the risks that a company will face if the market changes. These ongoing decisions heavily impact stakeholder confidence and thus the firm’s sustainability. As such, firms have no choice but to translate historical data into forecasts that can help them make informed decisions. It does not matter whether they are investment bankers, equity analysts, or venture capitalists. They all need accurate data on aspects such as asset prices, stock returns, and market volatility.
But here is the problem. Unlike macroeconomic data, which tends to be quite stable, financial data is often volatile. One minute, financial markets may be stable, and the next, they could change quite fast and significantly, which leaves financial organizations in a bit of a bind.
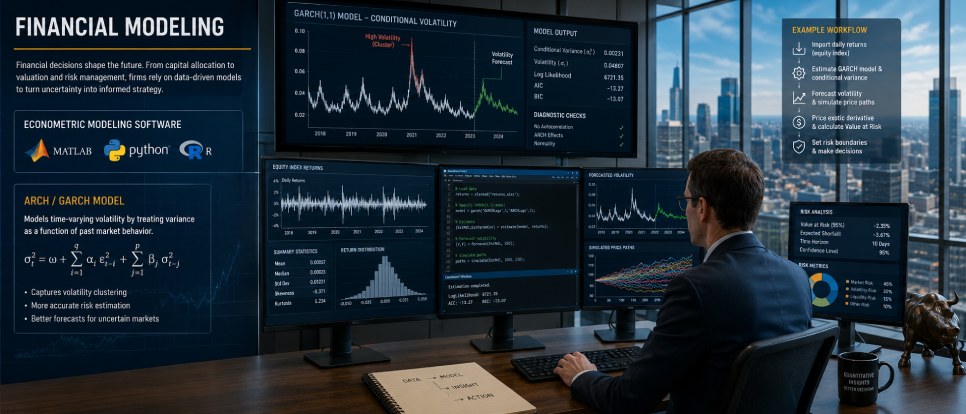
Can econometric modeling software help? Absolutely. Tools such as MATLAB, Python, and R are often used in financial modeling because of their high processing speeds and accuracy. ARCH/GARCH (Generalized Autoregressive Conditional Heteroskedasticity) is a good example of this. While traditional statistical tools assume that volatility is a constant, these GARCH models account for the fact that variance can change over time and thus treat it as a function. This and other nuances introduced through econometric modeling software are the reasons more financial firms have turned to these newer tools.
Example
Suppose a hedge manager wants to price an exotic derivative and calculate its Value at Risk, which is the maximum expected loss over a given period. They can import the daily returns of an equity index into a tool like MATLAB and apply a GARCH model that can estimate the asset’s conditional variance. The software can then analyze past market changes and project how long the volatility will last before using these estimates to simulate future price paths. The hedge fund manager gets to price the fund accurately while setting risk boundaries.
Policy Analysis
Whenever governments introduce new laws, subsidies, or regulations, they receive feedback from their citizens, which can be positive, mixed, or negative. But have you ever wondered whether they take the time to review the likely outcomes before sharing their decisions with the world? Well, they do through a process known as policy analysis.
You see, policies are designed to solve societal problems such as food deserts and rampant crime. But given the complexity of these problems, lawmakers often have to weigh different options to determine the one that will yield the best results. Unfortunately, in the world of politics, there are many grey areas, such that lawmakers are often subject to the effects of what is happening in the world. As such, their decisions are not always objective and can be swayed one way or the other by public opinion, their own interests, and external pressures.
For these reasons, many policymakers have been relying on policy analyses through econometric modeling software. These analyses enable them to use the existing data and project the outcomes so that they can make decisions based on evidence rather than political pressure or opting for a trial-and-error approach. Furthermore, these analyses enable them to save money because they can identify the most cost-effective way of reaching a goal. And when done right, they earn them a favorable public opinion.
While there are many tools used in policy analysis, Stata and R take the lead here. These allow policymakers to review what would happen to society if the policy were not in place. For instance, with the differences-in-differences framework, lawmakers are able to compare the changes in outcomes over time between a group that received the policy and another that did not. Propensity score matching is another technique that allows lawmakers to mimic a randomized experiment that compares individuals with similar characteristics and gauges the effects of the policy on them.
Example
Let us assume that a government wants to know if its new healthcare subsidy will improve health outcomes for people in low-income households. They can take their census and health records and load them into Stata, then perform propensity score matching. This command will allow the software to run a logistic regression to calculate the probability of receiving the subsidy based on factors such as income, age, and health conditions. This way, it can match people receiving subsidies with those who are not receiving the same, so as to determine the impact of the policy on health. The government would not have to guess how this would affect its citizens, as the output would inform their decision.
Academic Research
Our society heavily depends on academic research when it comes to the aspects of progress and innovation. After all, academic researchers come up with new knowledge, shape public policies with their recommendations, create new technologies and products, and combat the misinformation that exists in the world. From professors to graduate students and postdoctoral researchers, we have people who work night and day to further the knowledge that we have.
But in order to be successful in their quests, researchers must review the existing bodies of research, as these allow them to test economic theories, determine structural relationships, and discover new knowledge that they can then publish in peer-reviewed platforms. Given the long-term impacts of their work, researchers need to not only be transparent about their processes but also handle data accurately, which is why they use econometric modeling software.
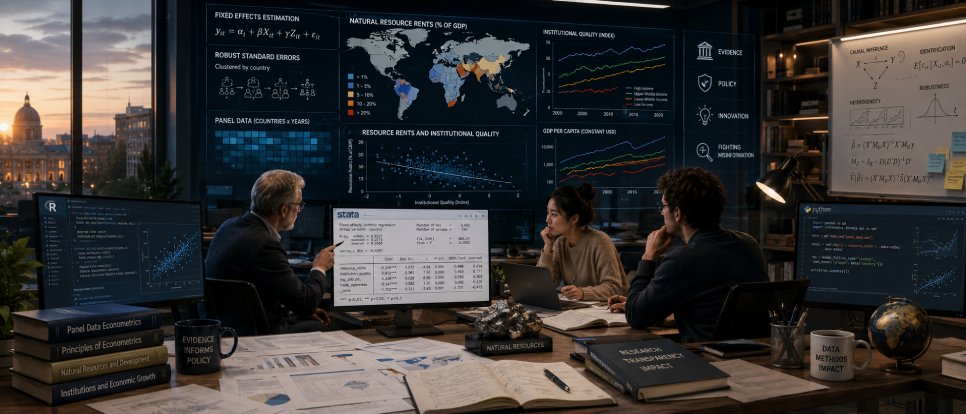
R, Stata, and Python are some of the most commonly used tools in academia, more so when researchers are tracking the same set of data over a long period, as these software allow them to control for individual characteristics. Say, for example, that researchers are handling panel data. They can use fixed effects estimation to focus on only the variables that change over time rather than including those that do not change. These tools are also effective at adjusting standard errors in the data sets so as to make sure that the outputs are not the result of a statistical error.
Example
Say that an economist wants to test whether the discovery of natural resources in a developing nation can affect the quality of its institutions in the long term. They can compile datasets from several countries that have been collected over several years and import them into software like R before running a fixed effects regression of the institutional quality metrics against resource rents as a percentage of the gross domestic product. Since this model would hold constant factors such as location and legal systems, it would allow the researcher to hone in on the actual relationship between the natural resources and the quality of the institutions. And to ensure that the findings were valid, they could use R to test for and adjust standard errors.